Net dollar retention rate for SaaS:
free calculator template
 Adam Tzagournis, CPA · 7 min read
Customer churn can be a real blow to your SaaS business. That’s why it’s so important to keep track of your net dollar retention rate (NDR). This measures how well you retain customers from one year to the next. While the definition is pretty straightforward, compiling the data in the right way is messy. Any time you have to deal with changes over time, expect an Excel headache.
Lucky for you, we created a free NDR calculator and cohort analysis template to help you! Get it at the bottom of this post. 👇
Why does NDR matter?
Fundamentally, NDR matters because it’s much less expensive to keep an existing customer than to get a new one. Also, investors care because your NDR feeds into other metrics. For instance, it’s a key component of customer lifetime value (CLTV). In turn, CLTV is important because it tells you how “profitable” a customer is over the course of their relationship with your company.
How do you calculate net dollar retention rate?
To calculate your net dollar retention rate:
- Identify your customer base at the beginning of a 12-month period. Gather details like their start date and annual recurring revenue (ARR).
- Identify which of these same customers are still active at the end of the 12-month period, and what their ARR is. Account for any upgrades and downgrades.
- Divide the ARR of the customers retained (step 2) by the ARR of your original customer base (step 1).
NDR is easier to visualize with cohort analysis. While challenging to set up, it helps to see how customer cohorts change over time.
Gross dollar retention vs net
In this post, we’re focusing on NDR. However, there’s also gross dollar retention rate (GDR). GDR purposely excludes upgrades from its calculation. Doing so offers its own insights: the metric now emphasizes customer churn. In this case, upgrades don’t compensate for attrition issues.
Some prefer this approach. The logic is that companies can be taught how to upsell customers, but fixing churn is a harder problem. Still, we like NDR since it’s all-encompassing. We’ve found that most SaaS companies have at least 2 pricing tiers with the goal of upgrading suitable customers. Upgrades play an important role, especially in the context of a customer’s lifetime value to you.
How to interpret your net dollar retention rate
A net dollar retention rate of 100% could mean that you retained all of your customers from the previous year. Or, it could mean the dollars lost from churned customers were offset by other upgrades. An NDR above 100% means that upgrades exceeded churned dollars.
The ideal net dollar retention rate for SaaS companies is at least 100%. This means that, on average, SaaS companies are not only retaining their customers but also getting them to upgrade.
Let’s look at the most recent KeyBanc and RevOps Squared surveys for net dollar retention rate benchmarks for SaaS companies.
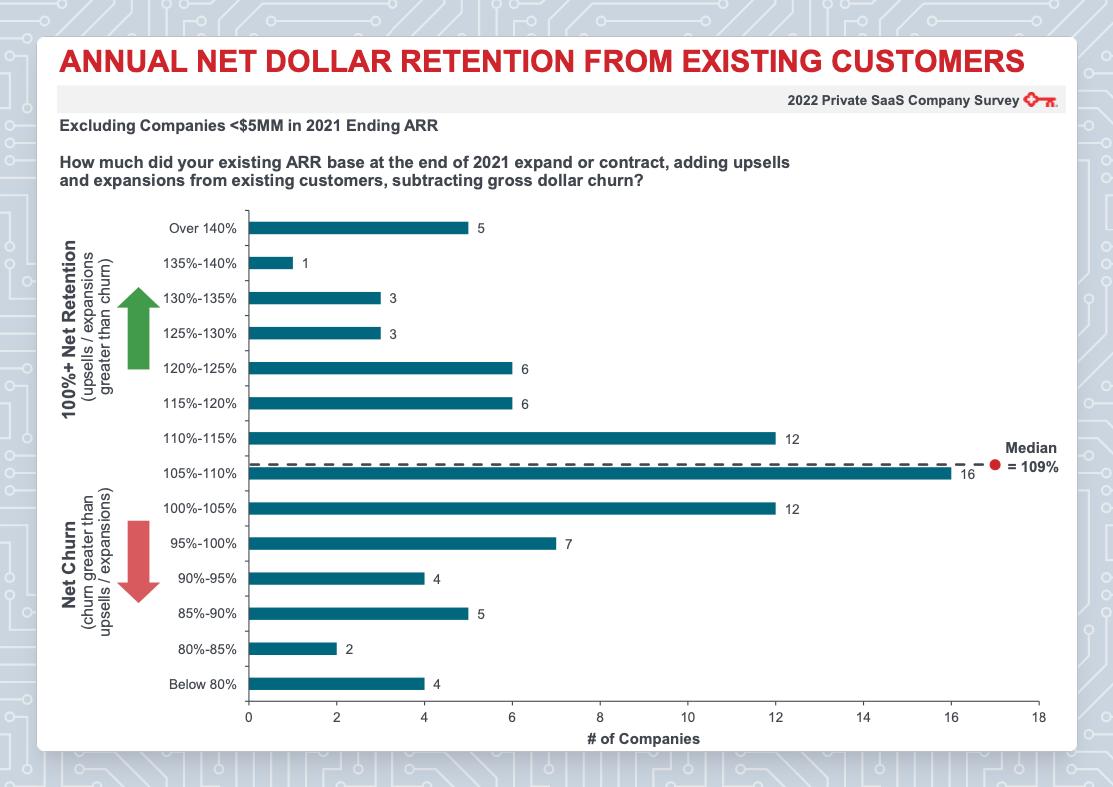
KeyBanc
According to the 2022 KeyBanc Private SaaS Company report, the median net dollar retention rate for SaaS companies is 109%. The top quartile is 120% or higher.
RevOps Squared
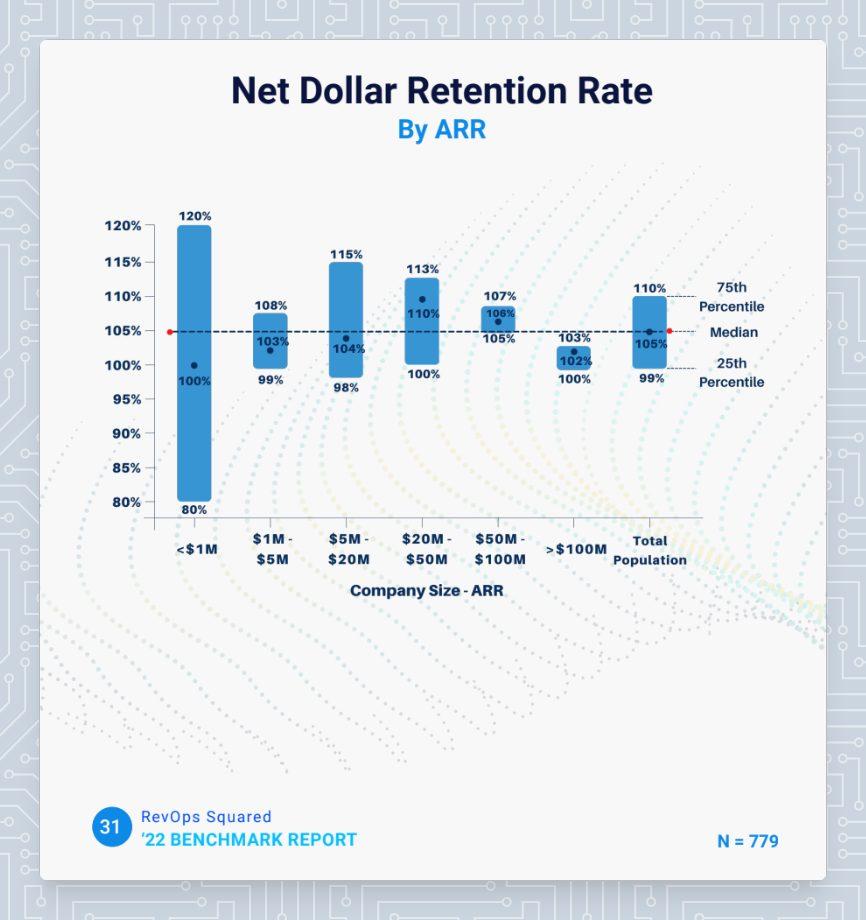
Similarly, the 2022 RevOps Squared B2B SaaS survey showed a median net dollar retention rate for private SaaS companies of 105%.
Regardless of a company’s total ARR, NDR was pretty consistent:
However, we do see a slight correlation between a company’s NDR and its average contract value.
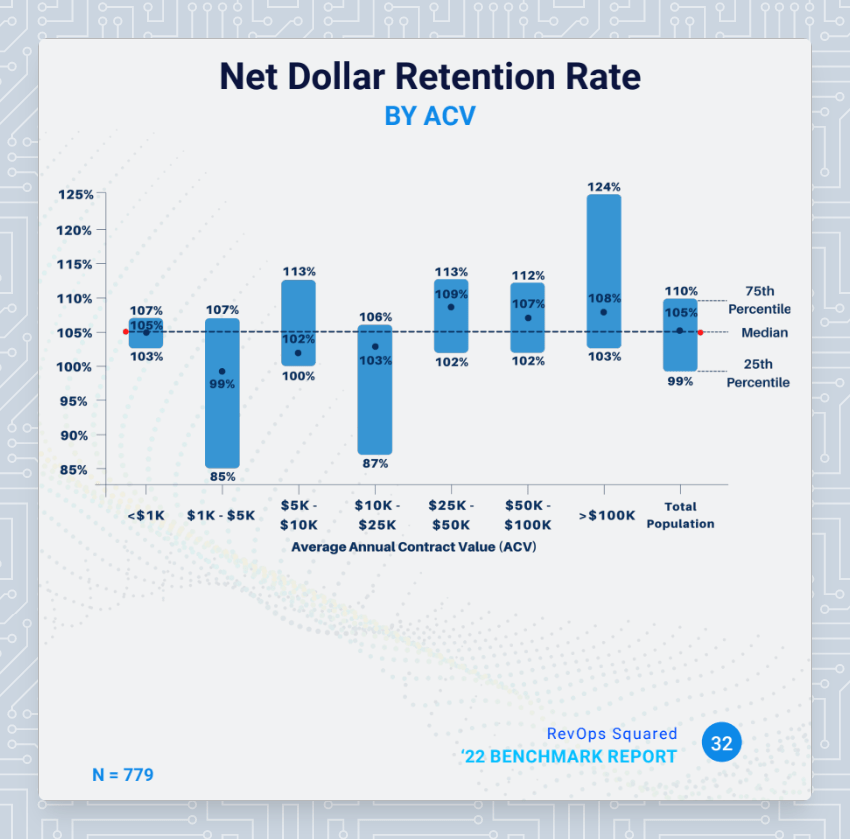
Larger deal sizes perform slightly better when it comes to renewals, but it’s hard to say why exactly. It could imply that customers who are willing to pay more have a higher incentive to set the product up correctly and actually use it. Alternatively, it could be that the company selling the product has a higher incentive to retain that customer, and will invest more resources into doing so. They may even offer professional services (despite lower margins) as an investment in retaining the customer. This chart supports that thesis:
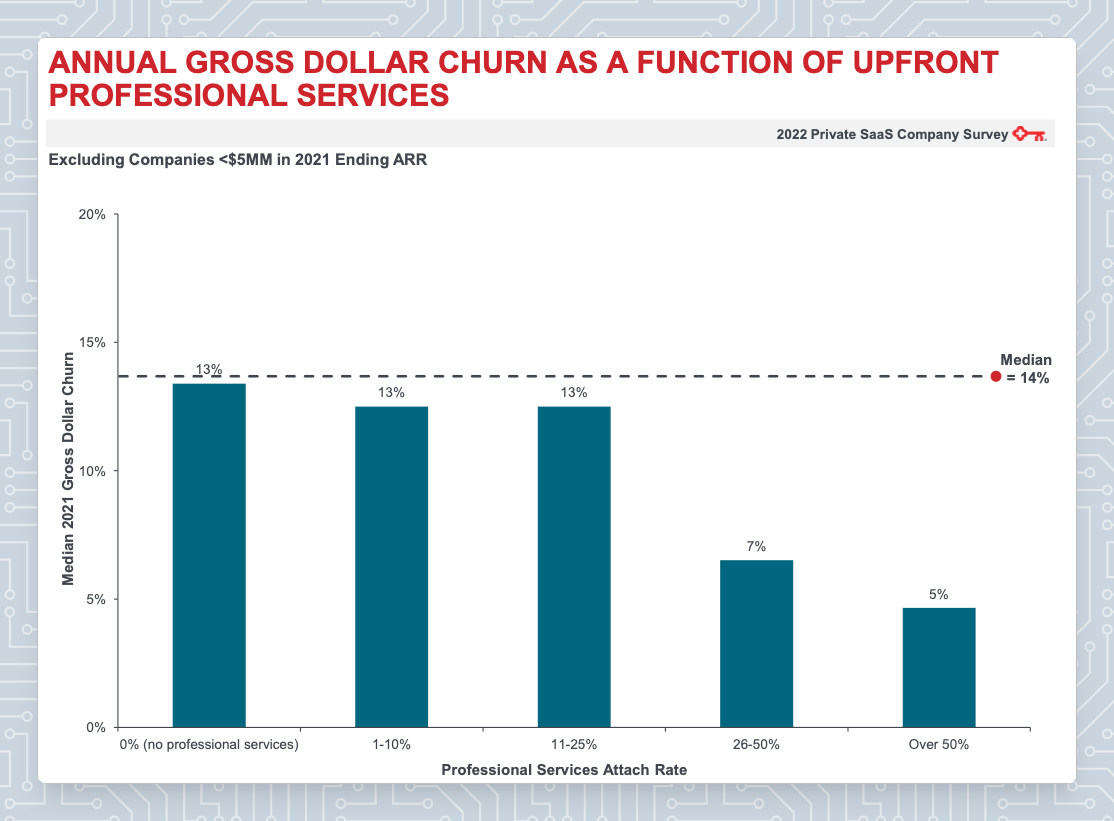
Here, we see churn as a function of the portion of customers that get professional services. Many SaaS companies don’t even expect professional services to be profitable at all. Nevertheless, it can be a valuable tool to ensure customer success.
Cohort Analysis
Cohort analysis can add more color to help you understand your NDR. It groups customers by their start date so you can see where upgrades, downgrades, and churn are happening.
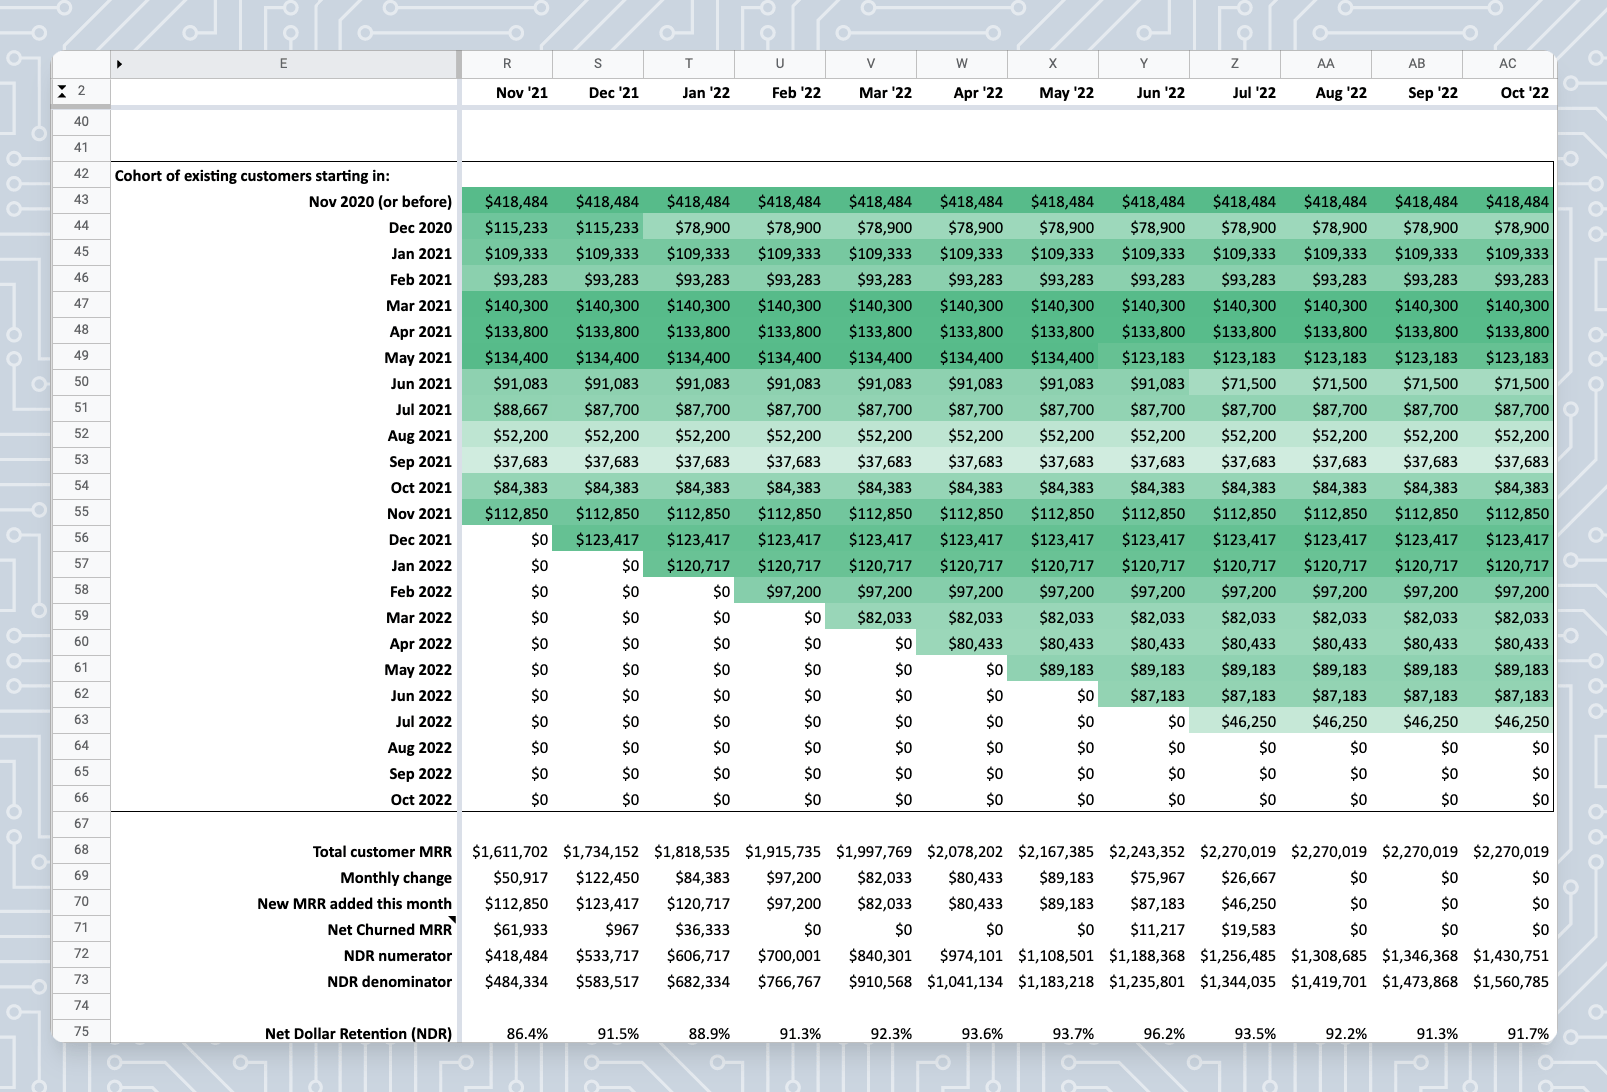
In some instances, it can reveal how your product’s perceived value impacts renewals over time.
This is especially true if your product has evolved rapidly in the past two years. In this case, a customer that starts in Dec 2020 has a very different experience with your product (and different usage habits) than one that starts in Dec 2022. This matters because your NDR changes as older cohorts (with renewal rates worse than newer cohorts) start to become excluded from the calculation.
If you do look at NDR by cohort, proceed with caution. Sometimes, external factors like the macroeconomic environment play a role in the timing of churn or renewals. Consequently, the results may be deceiving if you attribute them to your product. Instead of scrutinizing each cohort’s NDR, use cohort analysis to get an overall sense of how these cohorts are trending.
Bonus: logo retention rate
While it’s not the focus of this post, logo retention rate is also important to track. This metric measures the count (not the dollars) of customers retained from a given cohort. By definition, the maximum is 100%. For SaaS companies, you should expect logo retention rate to hover around 75-90%. However, this range doesn’t apply if your ACV is less than $1k. Companies in that range had much lower logo retention rates.
You may have noticed that this varies from the NDR by ACV graph above. It could be that these companies with less expensive products have a freemium or land-and-expand business model. In that case, you’d expect to see more churn, with upgrades making up the difference. In other words, NDR ends up in the same spot as companies with higher ACVs.
Free net dollar retention and cohort analysis template
Use our free net dollar retention and cohort analysis template to get started! Simply enter your company’s data and we’ll do the rest. You’ll be able to see a full cohort analysis of your existing customer base. Keep tabs on your net dollar retention rate and ensure that your company is on track for success!
Don’t want to worry about calculating net dollar retention rate? Our financial model software for SaaS companies does it for you automatically. You can start for free too (yes, even the onboarding)!