SaaS Revenue Projections:
New Customer Growth
(Part I)
 Adam Tzagournis, CPA · 4 min read
A VC is analyzing your SaaS revenue projections for the first time and discovers more questions than answers. She asks how you plan to acquire such a high volume of new customers. Before you get the chance to respond, you wake up. You’re relieved, knowing you took a bottom-up approach to forecasting!
Started from the bottom now we're here
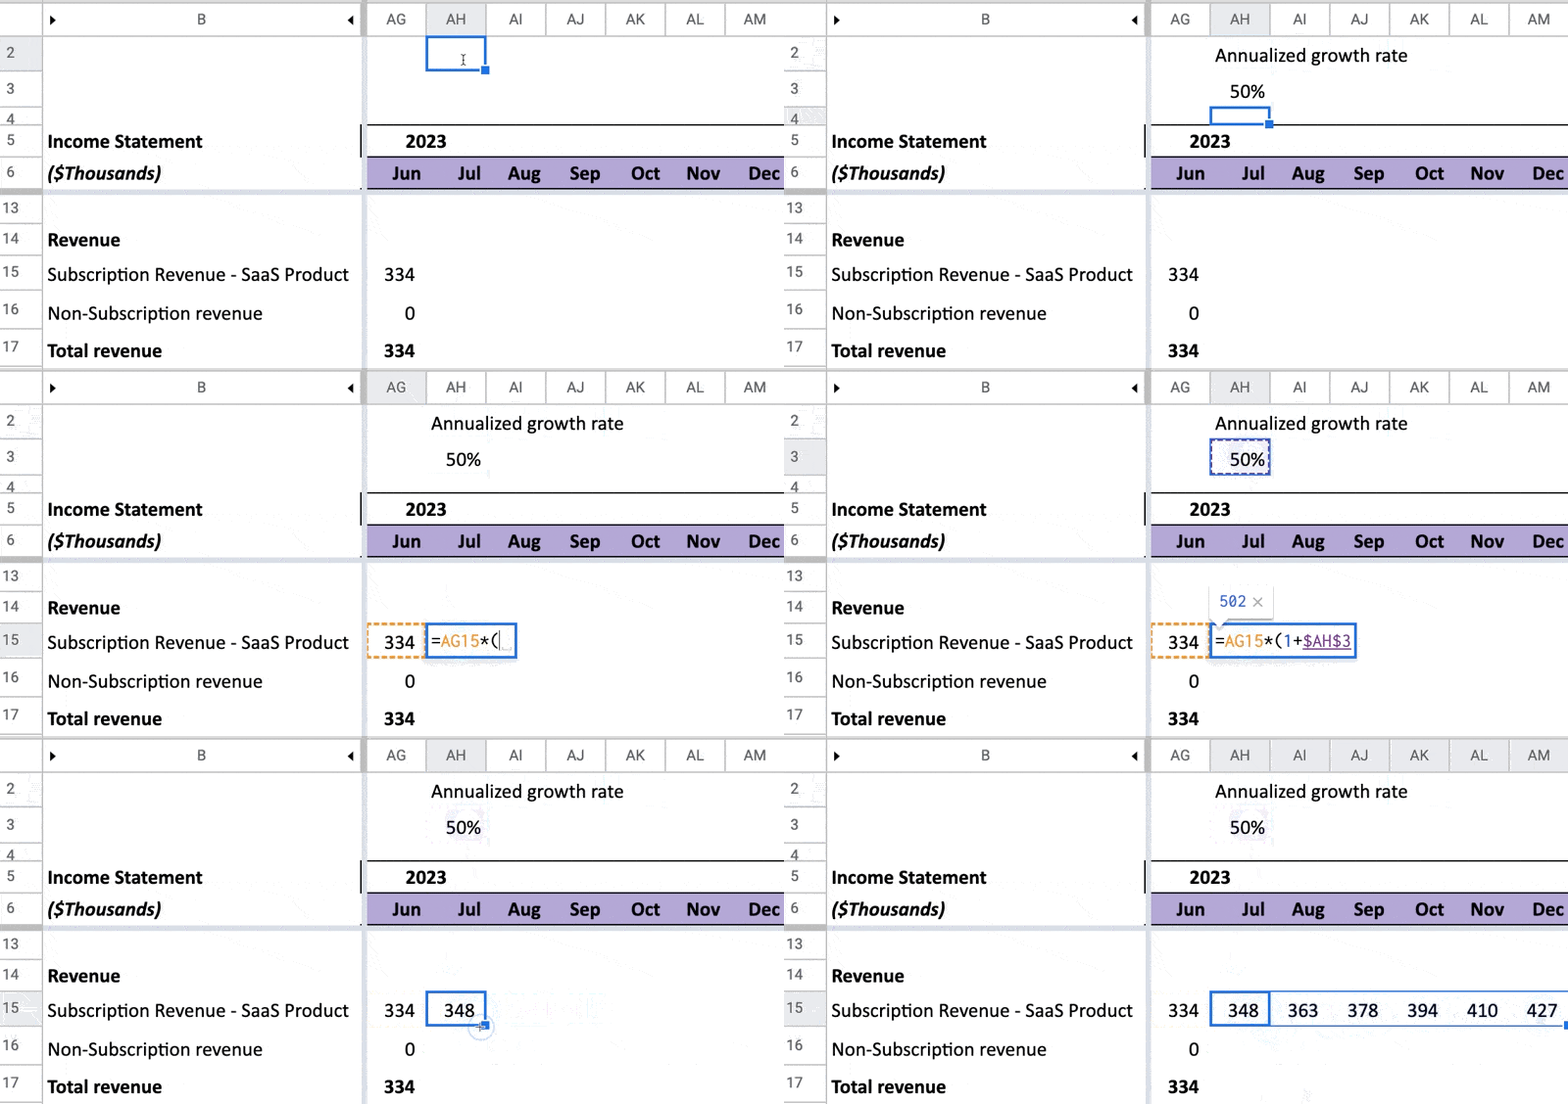
We’ve talked about the importance of a bottom-up approach instead of top-down. As a quick reminder, this is what top-down looks like:

See why we don’t like this witchcraft? It assumes the answer (the percent growth) as the starting point rather than deriving it.
Funnels
SaaS revenue stems from new customers and renewals. While the latter gets a lot of attention (since recurring revenue is the magic of SaaS), in this post we’ll focus on forecasting new customer growth.
Let’s take a bottom-up approach. This means we’ll start with the output we’re projecting and work backward. In this case, new customers start off as leads. And those leads come from sales & marketing efforts. In other words, we must model the chain of events (i.e. conversion rates) to get from prospect to customer. With this approach, your SaaS revenue projections are far more credible than the forbidden shortcut shown above.
A note before we dive in: it’s important to break out your new customer growth forecast by pricing plans or market segments. That’s because each will behave differently and thus should have distinct assumptions. If you don’t have more than one, you don’t need to worry about this.
Marketing funnel
Your marketing funnel should have the following inputs/assumptions for each pricing tier:
- total monthly spend that generates opportunities
- growth rate of this spend
- the cost to get a single lead or opportunity
- whether it gets cheaper or more expensive in the future
- lag time between marketing spend and when an opportunity is generated
Sales funnel
Your sales funnel should have the following inputs/assumptions for each pricing tier:
- monthly new opportunities sourced per sales development rep (SDR)
- monthly new opportunities sourced per account exec (AE)
- growth rate in efficiency for SDRs and AEs
Bottom of the funnel
Marketing and sales are the sources of opportunities. Next, they converge into the bottom of the funnel. Here, there are a few more inputs:
- win rate (prospect -> customer)
- growth in this win rate over time as your sales reps get better at closing
- sales cycle length (the lag time to go from prospect to customer)
To take it a step further, you can also choose to apply a drop-off rate during the onboarding phase. This is especially important if you have a complex implementation.
Similarly, reuse this logic (if your product has a free trial) to model the conversion of free to paid customers. You can match the setup length to the free trial. For more conservative projections, round up the setup time so it totals at least one month. That way, you won’t overshoot projections relative to reality.
The video and accompanying template below will explain more.
Also, here’s the link for the free SaaS financial model template used in the video.
Conclusion
To sum up, your SaaS revenue projections must have sound logic for forecasting new customer growth. Instead of top-down sorcery, go with a bottom-up approach. That way, you’ll be confident when speaking with your board or investors (who’ll inevitably ask about it).
Thinking there’s got to be an easier way? Our financial model software for SaaS companies forecasts new customer growth for you using a bottom-up approach. You can start for free too (yes, even the onboarding)!
